Getting started
Install
From the PowerShell Gallery, on the PSU server:
Install-PSResource -Name PowerShellUniversal.Component.ECharts
Install-PSResource -Name PowerShellUniversal.Component.Perspective
Install-PSResource -Name PowerShellUniversal.Component.Pivot
Or copy a built module folder into Modules/<Module>/<version>/ of your PSU repository (the release
zip on GitHub has that layout). Then use the module's command in any app; PSU loads the component
when a page uses it.
A first chart
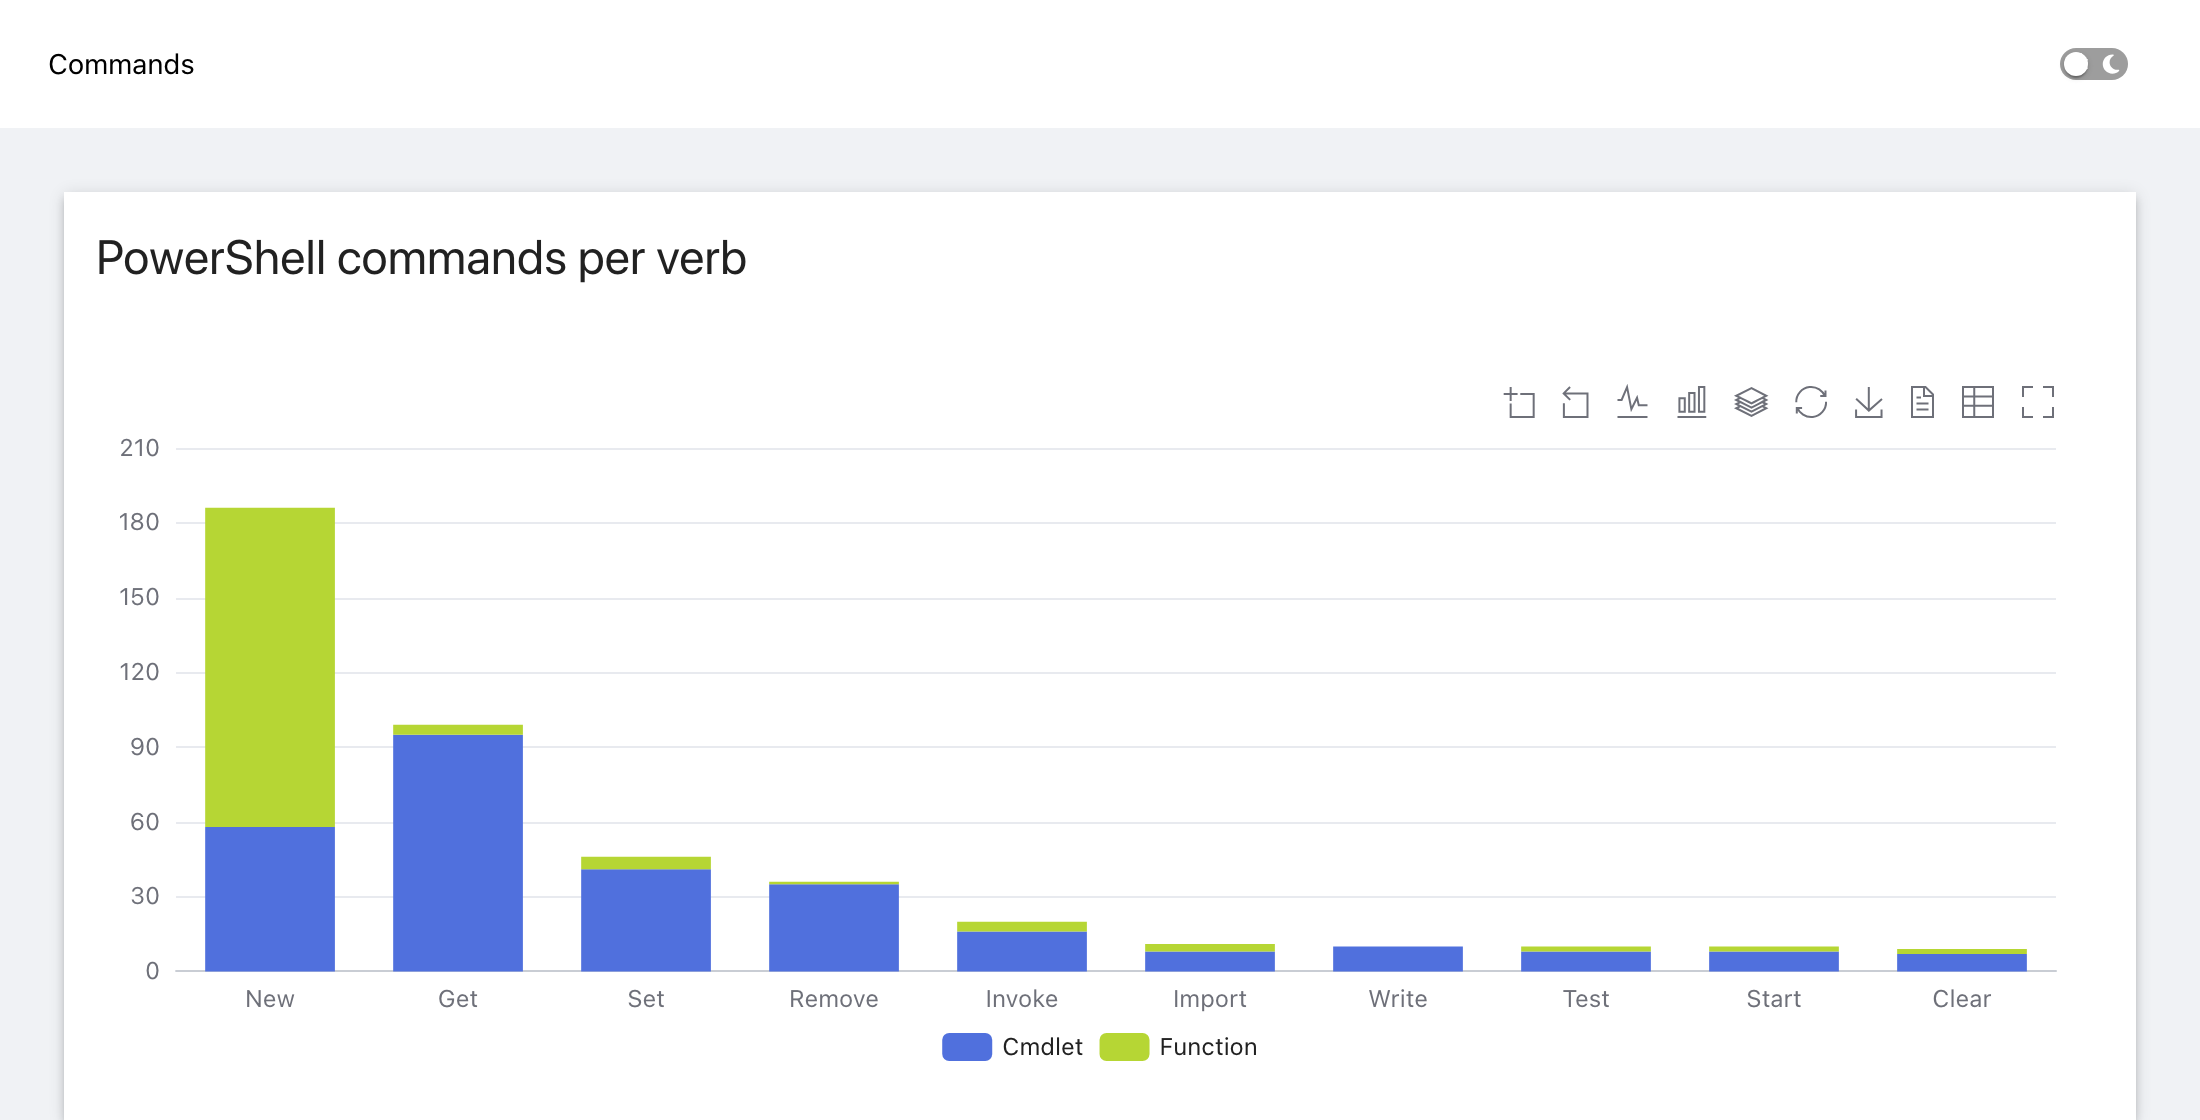
An app that runs on any PSU server, without a database or an API: the PowerShell commands of the server per verb, split into cmdlets and functions. A click on a bar shows a toast.
New-UDApp -Title 'Commands' -Content {
    New-UDCard -Title 'PowerShell commands per verb' -Content {
        $commands = Get-Command -CommandType Cmdlet, Function | Where-Object Verb
        $top = $commands | Group-Object Verb | Sort-Object Count -Descending | Select-Object -First 10 -ExpandProperty Name
        $rows = $commands | Where-Object Verb -In $top | Group-Object Verb, CommandType | ForEach-Object {
            [pscustomobject]@{ Verb = $_.Group[0].Verb; Type = "$($_.Group[0].CommandType)"; Commands = $_.Count }
        } | Sort-Object { [array]::IndexOf($top, $_.Verb) }   # most commands first
        New-UDEChart -Data $rows -Type bar -X Verb -Y Commands -GroupBy Type -Stacked -Height 360px -OnClick {
            Show-UDToast -Message "$($EventData.name): $($EventData.value) $($EventData.seriesName)s"
        }
    }
}
The same app is in the repository as examples/quickstart.ps1.
With your own data
The same call. From SQL Server, for example:
$byTeam = Invoke-Sqlcmd -Query 'SELECT Team, Priority, COUNT(*) AS Tickets FROM Tickets GROUP BY Team, Priority'
New-UDEChart -Data $byTeam -Type bar -X Team -Y Tickets -GroupBy Priority -Stacked
DataTables, Invoke-RestMethod results and PowerShell objects go in as they are; column names are
matched without regard to case. How the data is read: ECharts: Data,
Perspective, Pivot.
The same rows as a table readers rearrange themselves:
New-UDPerspective -Data (Invoke-Sqlcmd -Query 'SELECT * FROM Tickets') -GroupBy Team -SplitBy Priority -Columns Id -Aggregates @{ Id = 'count' }
Or as a report builder, where readers drag the fields into rows, columns and values, save their layouts as templates and export to Excel:
New-UDPivotReport -Id 'tickets' -Data (Invoke-Sqlcmd -Query 'SELECT * FROM Tickets') -Locale de-DE
With thousands of rows, give it a placeholder that shows the report's frame while the server builds the data: Pivot: loading and performance.
Try everything
The showcase app has 14 pages of charts with generated and public data:
Install-PSResource PowerShellUniversal.Component.ECharts.Demo, then New-UDEChartShowcase as an app's
content. The pivot showcase app works the same way:
Install-PSResource PowerShellUniversal.Component.Pivot.Demo, then New-UDPivotShowcase.