Using the viewer
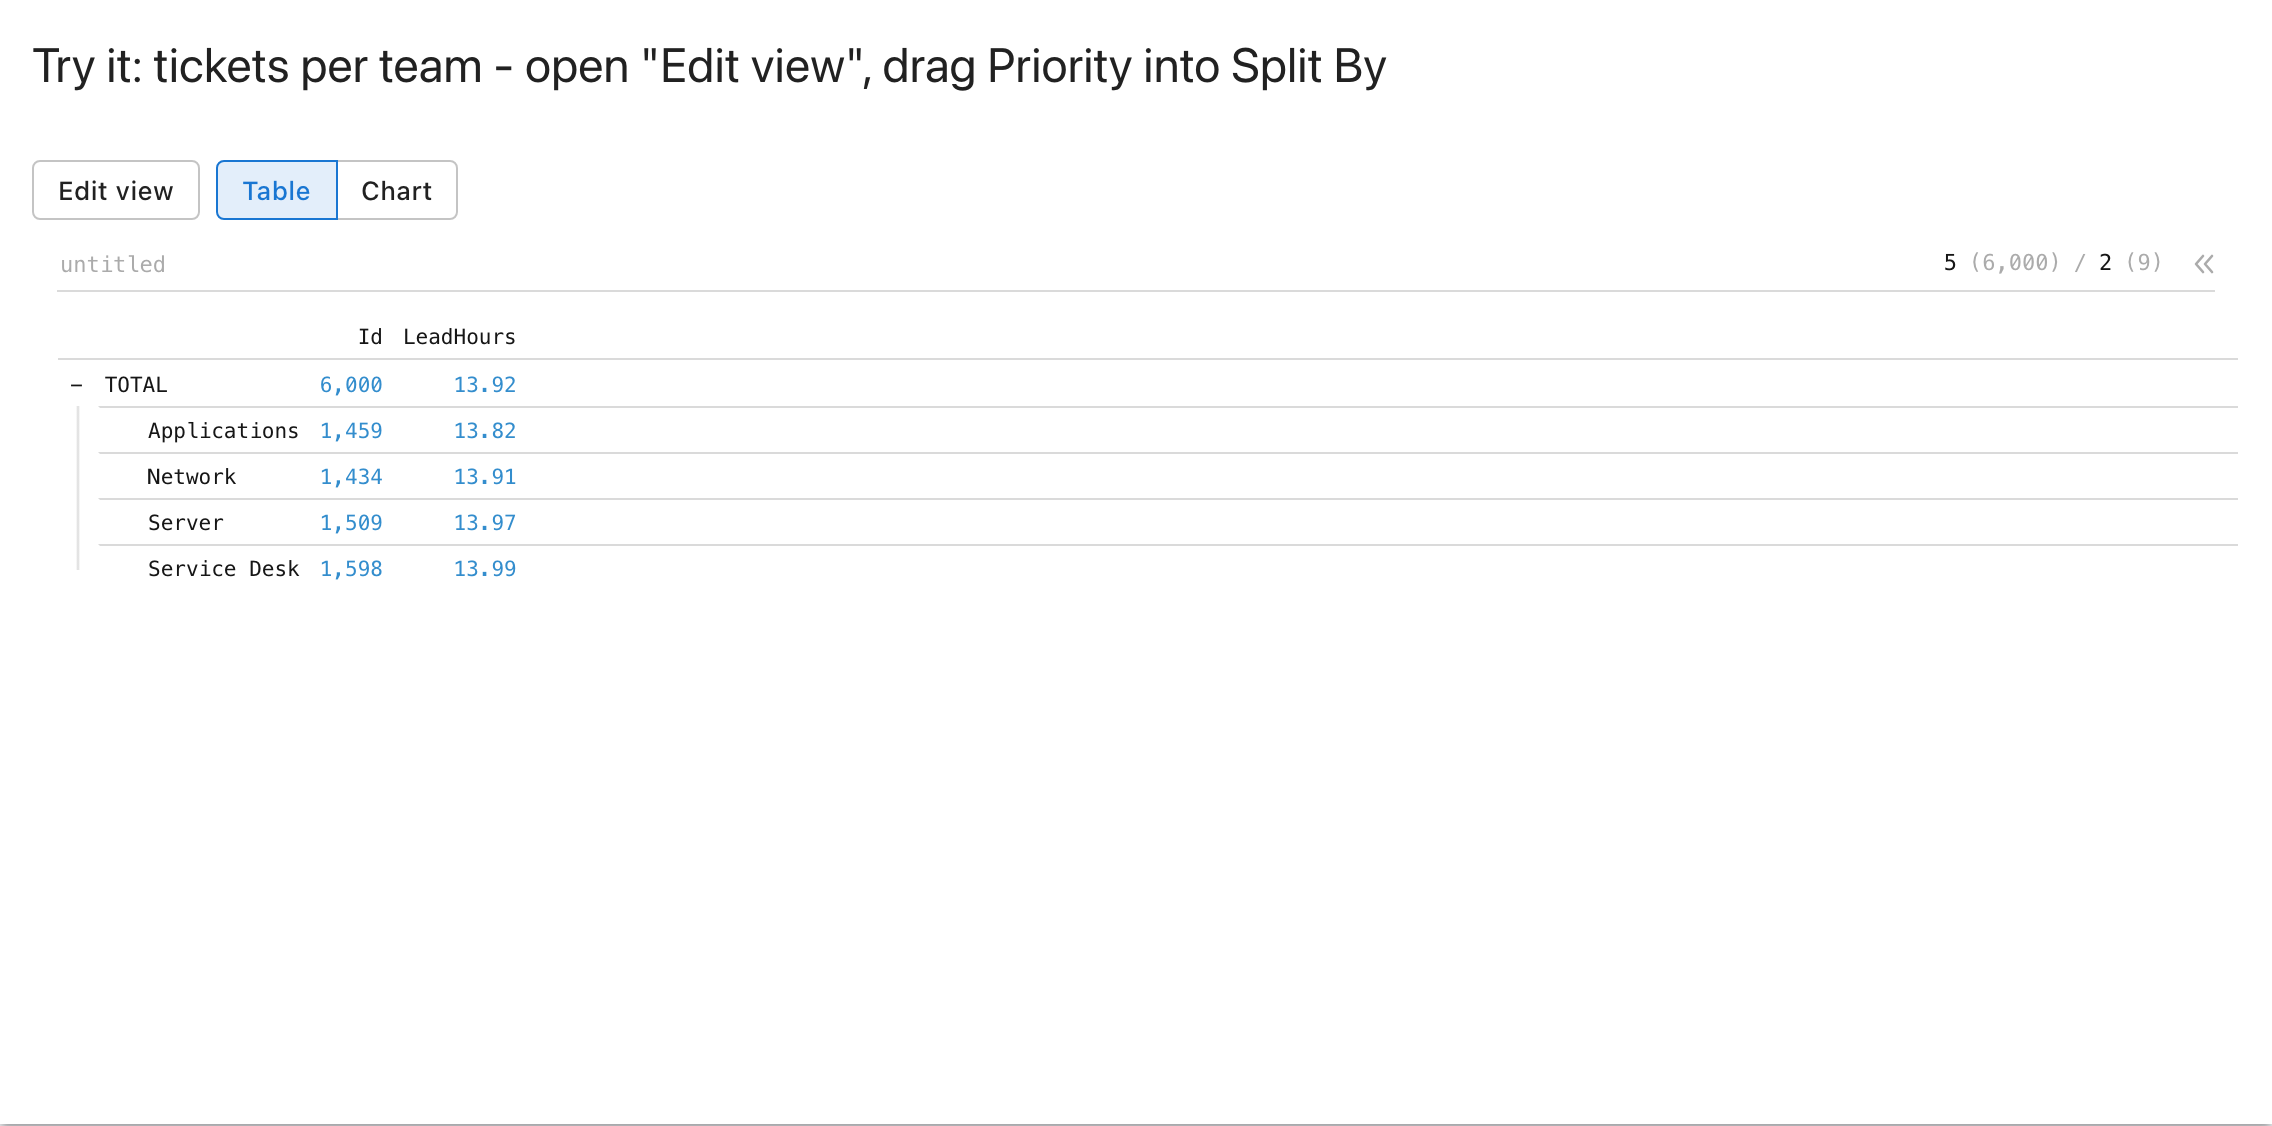
Every Perspective viewer has a small toolbar above it. Readers arrange the data themselves in three steps; nothing they change is saved, a reload starts again from the view the app set.
1. Edit view
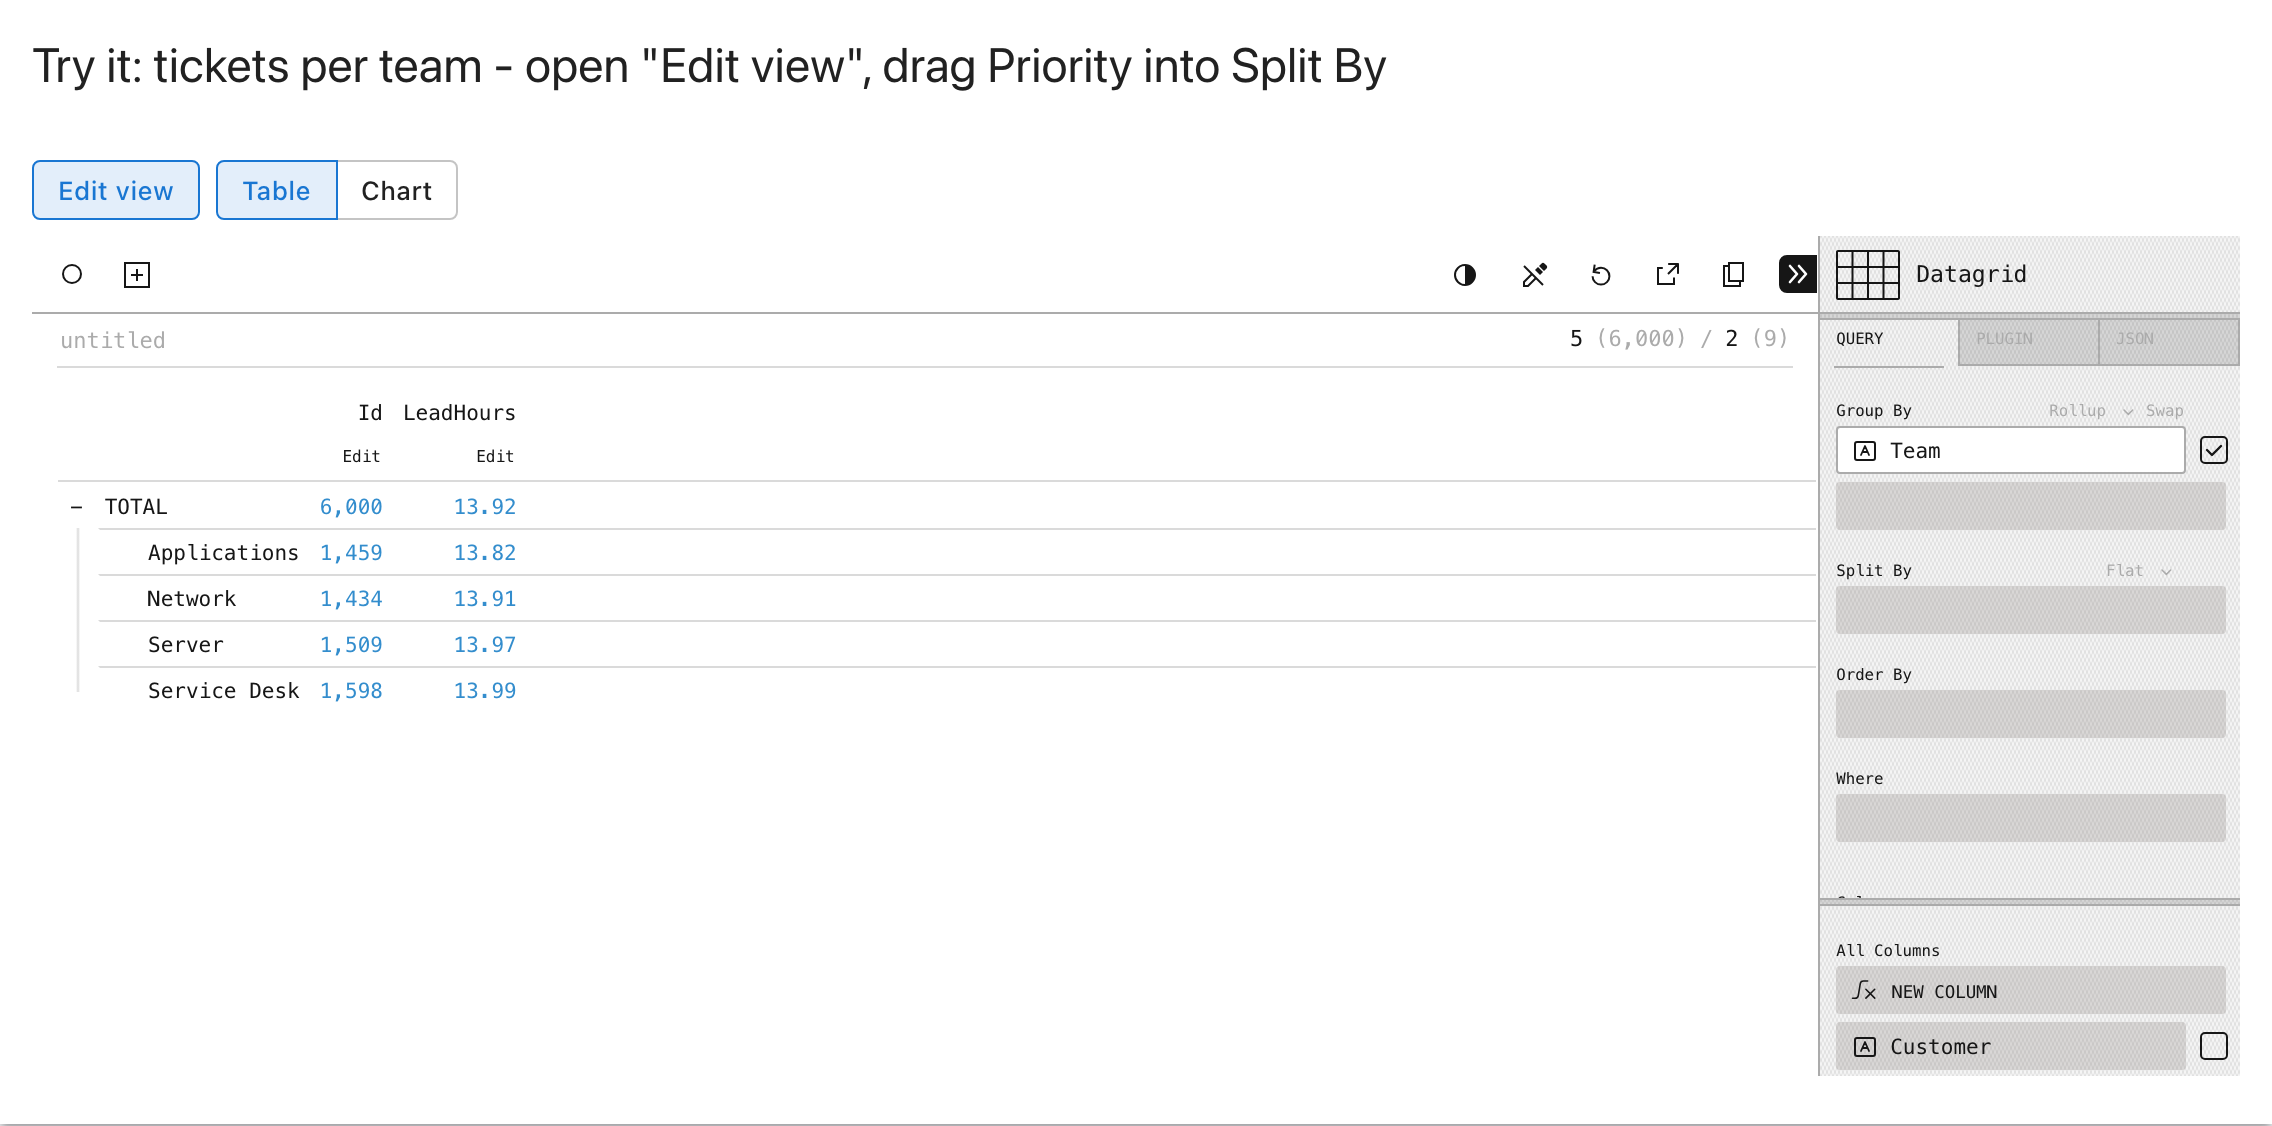
Edit view opens the editor next to the table, and closes it again. The arrow in the viewer's grey status bar does the same.
2. Pick what to show
At the top of the editor, the current view (here Datagrid, the table) opens the list of charts:
Y Bar, Y Line, Treemap, Heatmap and more. Table and Chart in the toolbar switch between the
table and the chart picked last (the app's -ChartPlugin, Y Bar unless set, until the reader picks
another one).
3. Drag columns
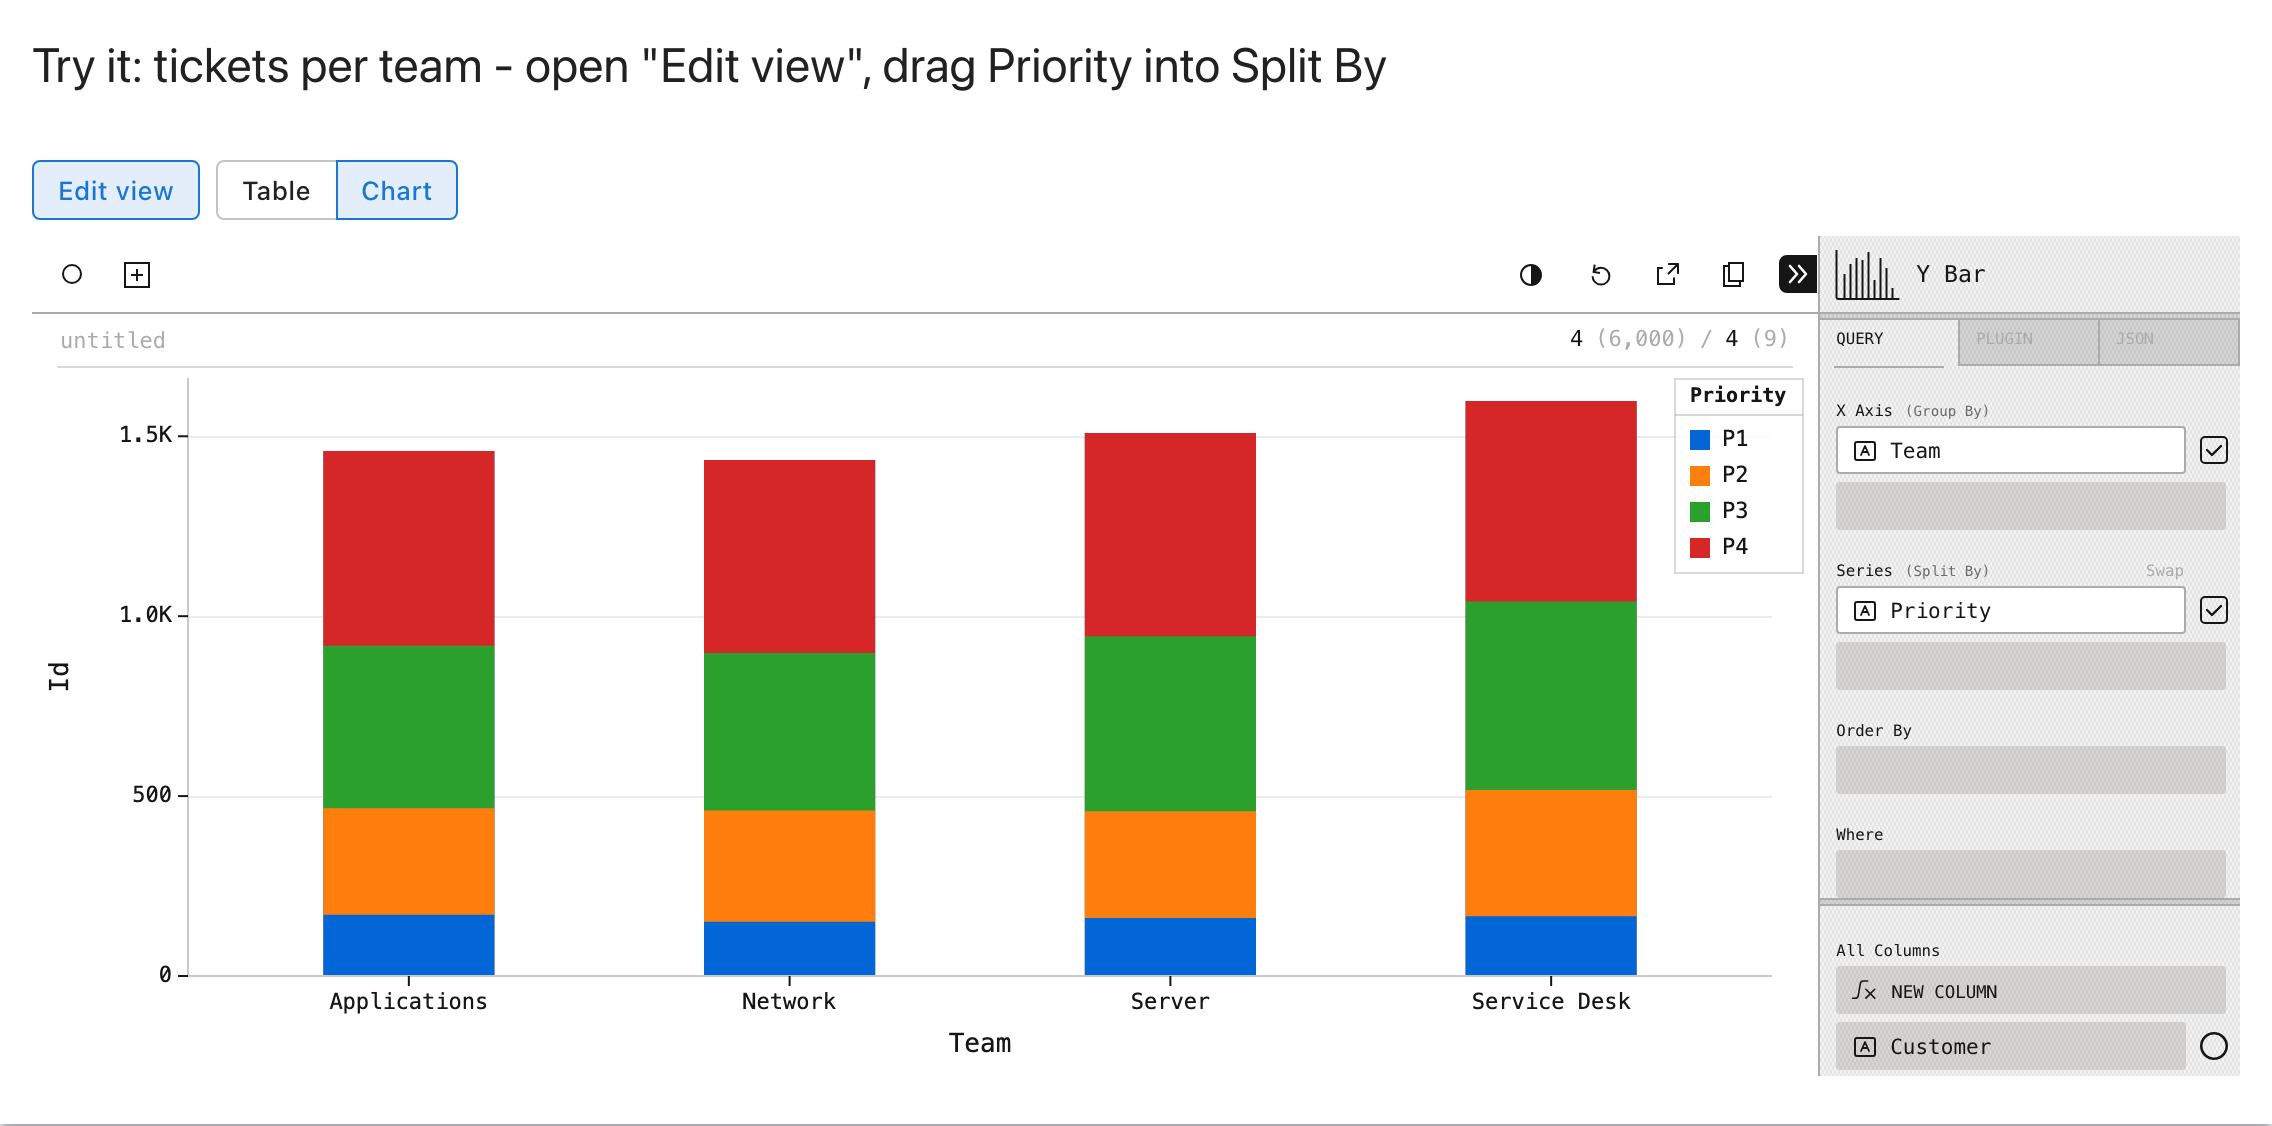
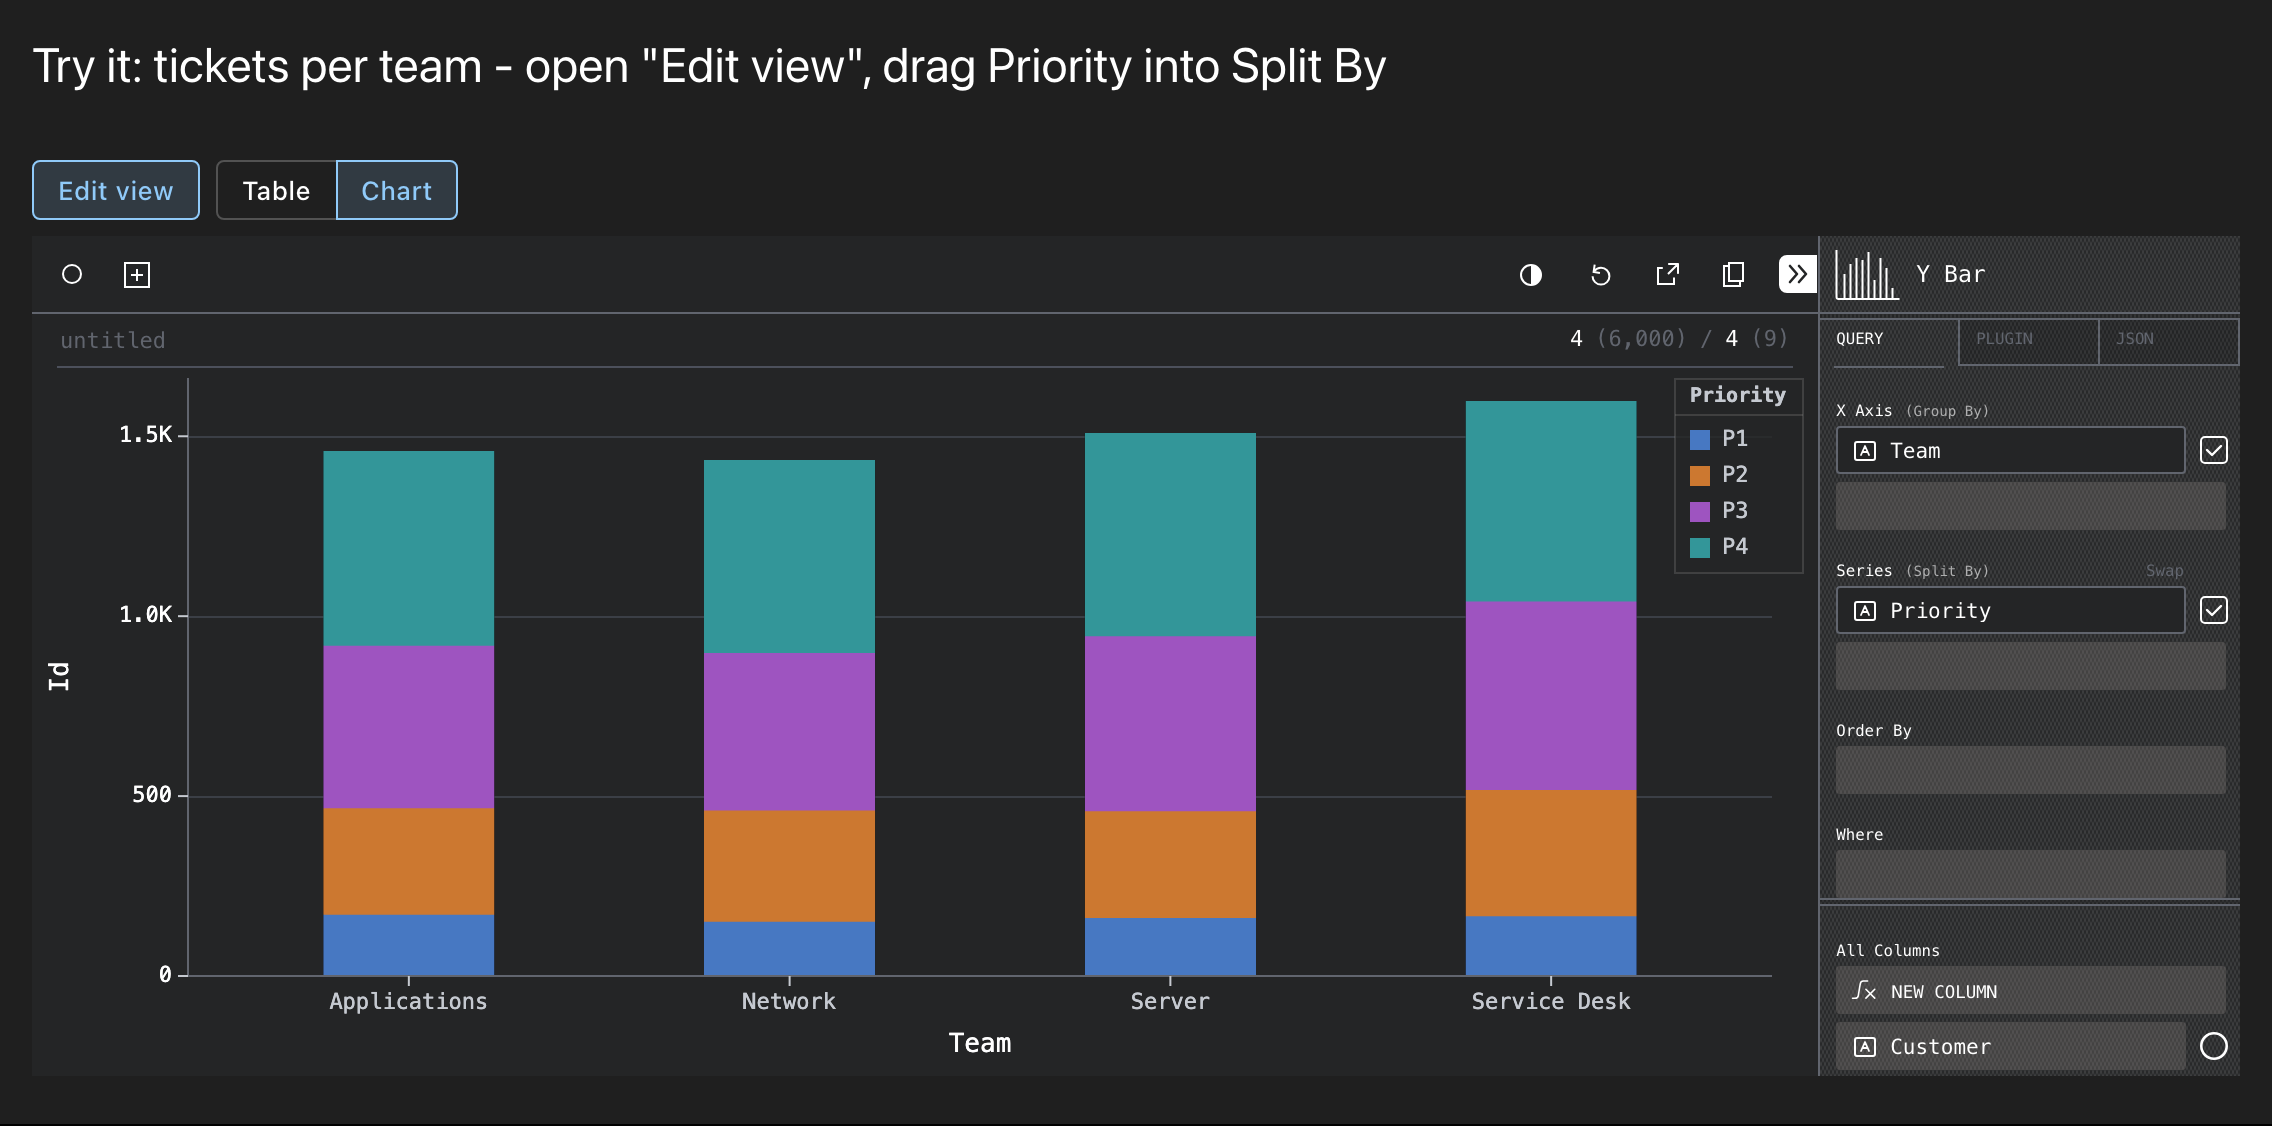
Drag a column from All Columns into Group By (rows, or the x axis of a chart) or Split By (columns, or the series of a chart). Next to each shown column, the aggregate says how values are combined (count, sum, avg, ...). Where filters, Order By sorts. The same view as a stacked bar chart, after dragging Priority into Split By:
For the app
-Labels @{ EditView = 'Ansicht bearbeiten'; Table = 'Tabelle'; Chart = 'Diagramm' } puts the
toolbar into another language, -ChartPlugin Treemap chooses the chart of the Chart button,
-NoToolbar hides the toolbar. The module's showcase app
(examples/showcase.ps1)
has pages for tickets, assets across source systems and costs, each starting with a view the reader
then changes.